You likely would have heard of predictive AI analytics, machine learning or data driven decision making. These big words describe different flavours in modern data analytics, but did you know that almost all of them can be framed as regression? Yes, the humble regression model!
The term “regression” dates back to the 19th Century, when Sir Francis Galton first conceived modern notions of correlation and regression. Galton’s interests were in genetics, he initially used the method to examine characteristics of the sweet pea plant – assessing genetic influence of the mother pea to the daughter.
These analyses are computational, and it has been claimed that before the 1970’s, it could take up to 24 hours to receive results from a single analysis. So it is the wide availability of computers that catapulted regression into the stratosphere. [Source: Regressions: Why Are Economists Obessessed with Them?]
Today, regression methods continue to be an active area of research, making it more accurate, more robust and more computationally efficient.
According to the Harvard business review, regression analysis is the “go-to method in analytics”, and smart companies use it to make decisions about all sorts of business issues. “As managers, we want to figure out how we can affect sales, retain employees, or recruit the best people. It helps us figure out what we can do.”
Here we give a brief run down:
Regression Basics:
The two main terms used in regression is:
predictor variable: X
response variable: Y
The predictors X are known and can be controlled or measured. The response Y is the quantity of interest, often the interest is in predicting Y given a particular values of X, or in understanding how the changes in X affect Y.
Let’s take a look at an example using the Advertising Sale data set from Kaggle. If we are interested in the effect of spending on TV advertising on the sales, we can fit a linear regression model:
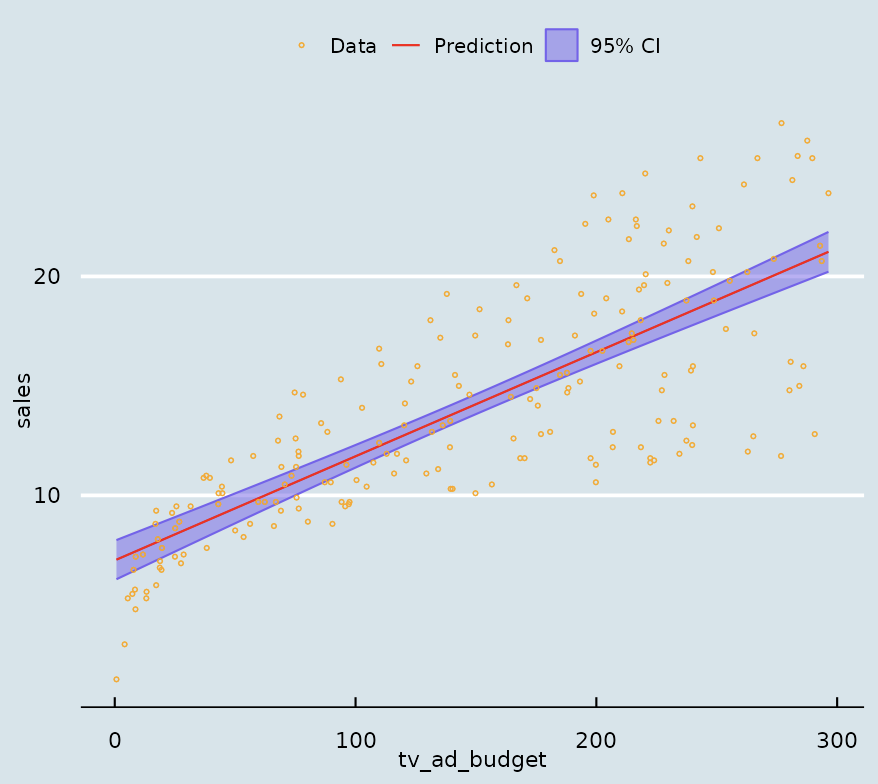
The raw data is plotted in orange and the regression line is shown in red, shaded in purple is how certain we are about our estimate of the line. The data tells us that sales income increases with TV advertising spending.
It is when we have many different X’s, hundreds, even thousands of variables, that’s when regression techniques really shine.
How to use regression:
There are many types of tasks that we can use the regression model to perform, here are a few of the most common ones:
Correlation: is used when we need to understand if X is really correlated with Y, beyond any uncertainty introduced through the noise in the data.
Prediction: is used when we want to know what to expect Y to be for a particular value of X.
Clustering/Classification: in this case when Y is discrete, for example, it can only be one of several outcomes a, b or c.
Examples of use cases:
Predictive AI analytics have been employed in many areas, here we take a look at a few:
Manufacturing/Smart factories: improving industrial operations, particularly in predictive maintenance and early product defect detection. It can also help businesses forecast equipment failures and optimize maintenance schedules, reducing downtime and maintenance costs.
Marketing and sales: to understand why did customers churn? What will sales look like after the ad campaigns, and decide how effective the campaign was.
Finance: employed in the finance sector for risk assessment, fraud detection, and investment portfolio optimization. It enables more informed and timely decision-making, reducing financial risks.
Fitness/health apps: individual app user data can be used to develop personalised health and fitness plans and recommendations.
If you liked this post, stayed tuned for our in-depth demonstration on how to perform regression stress-free!