
Many businesses come across a lot of data in their day to day operations, and most think they might be able to gain a competitive edge if they just knew what to do with these data.
The very first, and often under estimated task is to prepare a clean data set suitable for visualisation or analysis/prediction purposes. Here we provide a quick guide on how to do this.
Step 1: Combine the data from different sources into a single file. This can be a csv, xls (single excel file, not workbooks or sheets) or a simple text (.txt, these can be comma or tab separated) file. Most machine learning or statistical software such as R or Python will work with all these formats.
Step 2: Your dataset should be arranged in columns, where each of the columns is a measurement for a variable that you are interested in. The Advertising Sales dataset from Kaggle shown below gives an example:
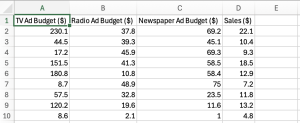
Step 3: Make sure the first row of the dataset provides meaningful names for the measurements in the respective columns:
Step 4: Make sure each column contains the same type of data, e.g., Sales ($) are numbers, so every entry in this column should contain numbers except for missing values. Acceptable data types are: integers, characters, numeric.
Step 5: Make sure each row refers to the same instance, for example, row 1 of the Advertising Sales data set correspond to the Sales ($) (22.1) when TV ad Budget was 220.1, and Radio Ad Budget was 37.8 and Newspaper Ad Budget was 69.2.
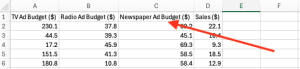
Step 6: Clean the data! Once you have made sure that you have a single excel or text file, make sure you remove any other text or images in the file so that your file looks like Step 2. Carry out further cleaning:
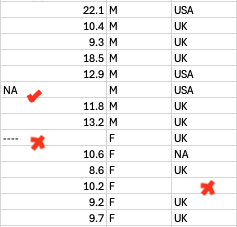
- If you have missing values, fill the blank cells with “NA”.
- If an entire row is missing, remove the row.
- If the column contain a mixture of data types, check and remove the missing values (replace them with “NA”).
- Check if there are any special values, for example the value “9999” which appears as a numeric value but may have been placed in the file to indicate missing or special values.
Now you are set to go! One of the first things you may want to do is some visualisation, or regression.